See what we do, before you commission it
We are newly founded, so this page has no past clients to show you. Instead it shows exactly what a study looks like when we run it: a worked example, the formats you would receive, and the checks that catch mistakes before you ever see them.
Illustrative example. Every name, number and finding on this page is invented to show the format. None of it describes a real facility, state or study.
Why this page, and not a list of past clients?
We are new.
Probatio Africa has not yet completed a study. A page of client logos and quotes we do not have would be a claim we cannot back.
Process is something we can show honestly.
What we can show, truthfully, is how a study is built: the questions it would ask, the checks built into it, and what you would receive at the end.
This is what any serious buyer checks anyway.
A written protocol, a real quality-assurance step and a sample of the output format tell a procurement officer more than a testimonial does.
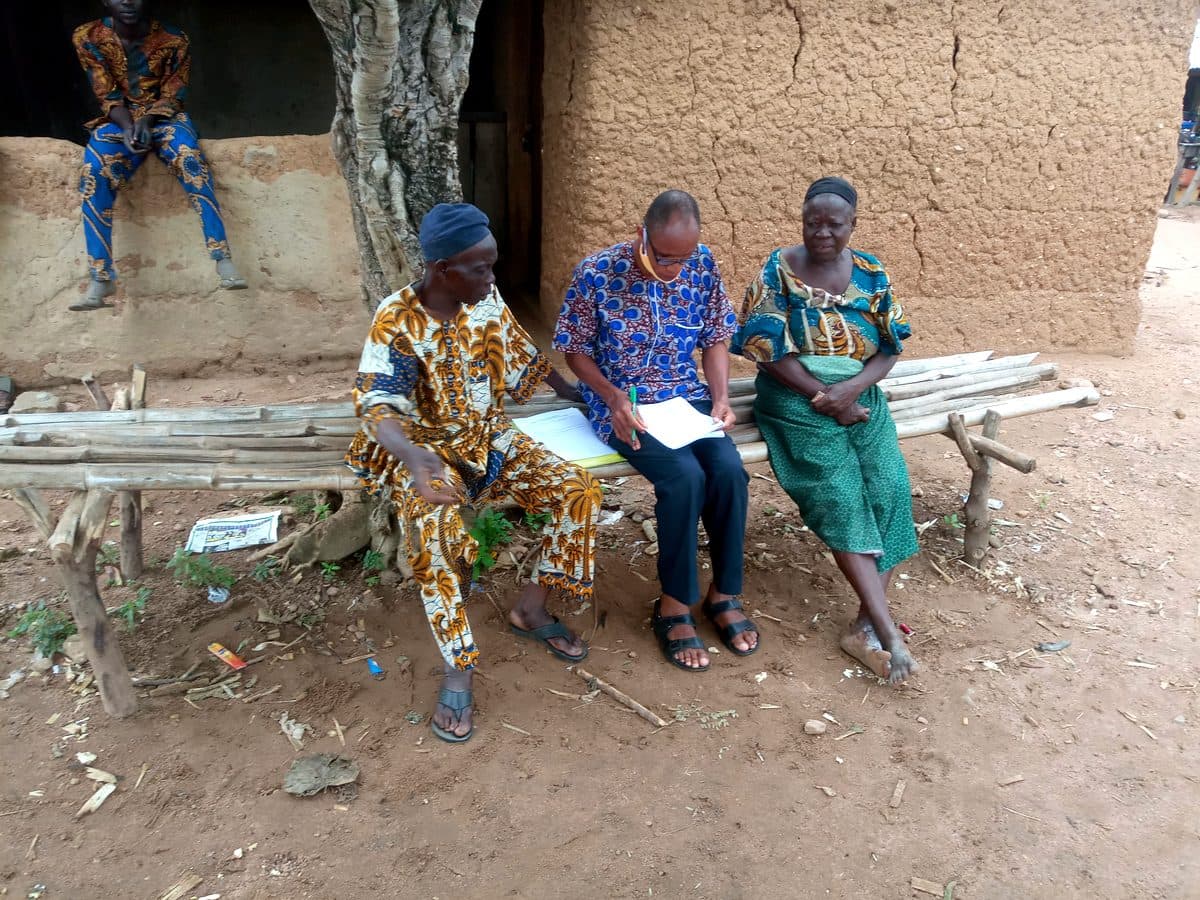
We now have real, completed studies to show — see our case studies page for those, named where the client has agreed and described by scope where they haven't. What follows here stays illustrative on purpose: a worked example built to show the format clearly, not standing in for a real report.
One of the studies people commonly ask for
A worked example: service readiness assessment
The question it answers
Which facilities can deliver what they promise today, and what would closing the gaps cost?
What you would receive
Service-level scorecards, ranked gaps and a costing.
Illustrative scorecard
Illustrative| Facility | Zone | Readiness score | Status |
|---|---|---|---|
| Facility A | North West | 41 / 100 | Survey estimate |
| Facility B | North West | 58 / 100 | Survey estimate |
| Facility C | South South | 77 / 100 | Survey estimate |
| Facility D | South South | 35 / 100 | Survey estimate |
A real scorecard names the actual facilities, states its sample and response rate, and states the margin of error. This one does not, because it is invented.
Ranked gaps (illustrative)
IllustrativeNo functioning vaccine refrigerator
Found at 3 of 4 example facilities. Estimated cost to fix: about ₦300,000 per facility.
No skilled attendant on duty at night
Found at 2 of 4 example facilities. Estimated cost to fix: a staffing change, not a purchase.
No running water at the point of care
Found at 1 of 4 example facilities. Estimated cost to fix: about ₦900,000 for a borehole.
Closing every gap across the four example facilities: about ₦3.1 million, or about ₦775,000 per facility.
A quality check, as it would appear in our log
IllustrativeThis is the level of detail a back-check log actually holds. “We do quality checks” is a claim; a log entry is a demonstration.
What the deliverables look like
Four formats, most studies produce some mix of these. Each excerpt below is invented to show the shape of the format, not a real finding.
The report
IllustrativeA findings section, split by group
Average readiness was lower in the North West example facilities (41 and 58, an average of 49.5) than in the South South (77 and 35, an average of 56), but the South South had both the best and the worst facility. A real report states the sample, the response rate and the margin of error at this point.
The issue log
IllustrativeOne line per problem found in the field
Facility A, 14 March: vaccine refrigerator not working at time of visit. Photographed. Escalated to supervisor same day.
The dataset
IllustrativeOne row per unit, ready to reload
facility_id: PA-FAC-004 | zone: south_south | readiness_score: 77 | refrigerator_working: 1 | water_source: borehole
The brief
IllustrativeOne page for a decision-maker
Three of four example facilities cannot store vaccines safely. Fixing this at the sampled facilities would cost about ₦900,000. A full state count would cost more, and we would say how much before you commit to it.
What we do not show you
The interview instrument in full.
We share the structure and a sample question, not the whole questionnaire, until you are a client.
The analysis code.
We describe the method, and name it, without publishing the scripts.
Anyone real.
No real facility, respondent, or partner appears on this page, named or not.
This follows ordinary consulting practice: show the thinking, the checks and the shape of the output; keep the proprietary detail and any real person’s information for an actual engagement.
The checks behind every study
A written protocol before fieldwork
The design, the sample, the instruments and the ethics route are written down and approved before anyone goes into the field.
Back-checks on a sample of interviews
A supervisor revisits a share of interviews and compares answers, as shown above.
A label on every figure
Official statistic, survey estimate, modelled or projected, or sources disagree — stated plainly, as on the scorecard above.
Results split by group
Findings are split by sex, age, disability and location wherever the data allow.
Ready to commission the real version?
Tell us the decision you need evidence for. We will say whether this kind of study answers it, and what it would actually cost and take.